description: cluster iris data set by hierarchical clustering and k-means
iris data set
1 | library(RWeka) |
delete class column
1 | datairis<-iris |
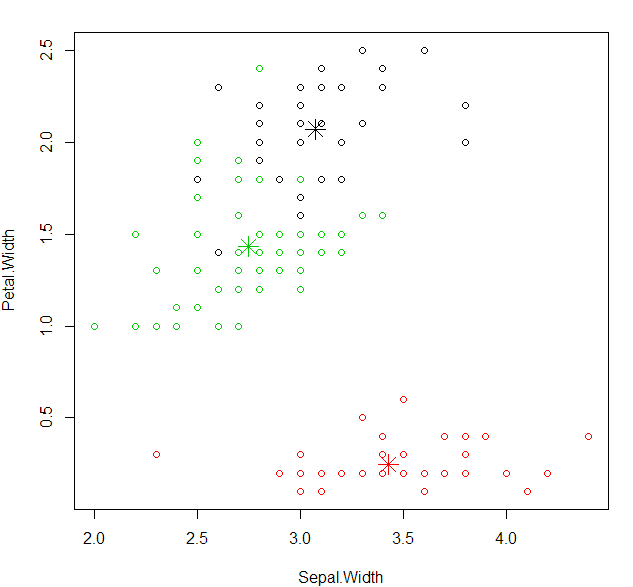
partitional clustering: K means clustering
1 | kcluster<-kmeans(datairis,3) # k as 3, divide into 3 species |
plot cluster with “Sepal.Width” and “Petal.Width”
1 | plot(datairis[c("Sepal.Width","Petal.Width")],col=kcluster$cluster) |
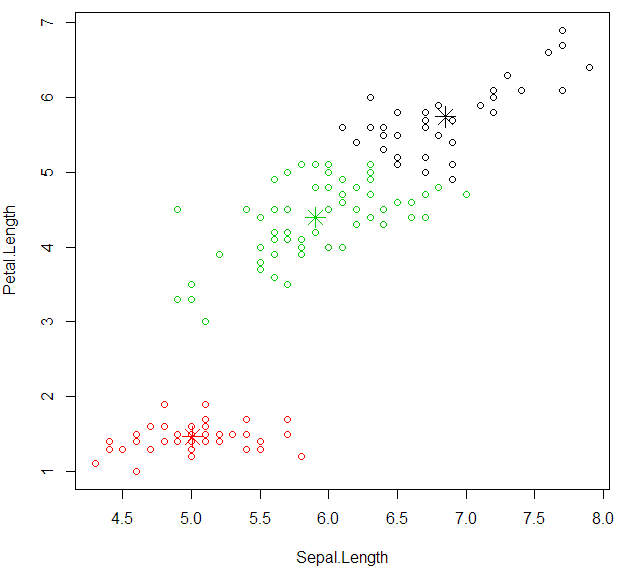
plot cluster with “Sepal.Length” and “Petal.Length”
1 | plot(datairis[c("Sepal.Length","Petal.Length")],col=kcluster$cluster) |
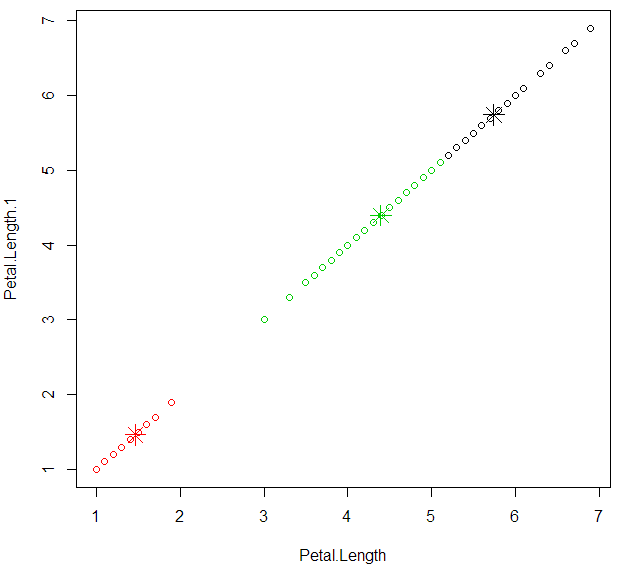
plot cluster with “Petal.Length” and “Petal.Length”
1 | plot(datairis[c("Petal.Length","Petal.Length")],col=kcluster$cluster) |
Check the result through a table
1 | iris$Species |
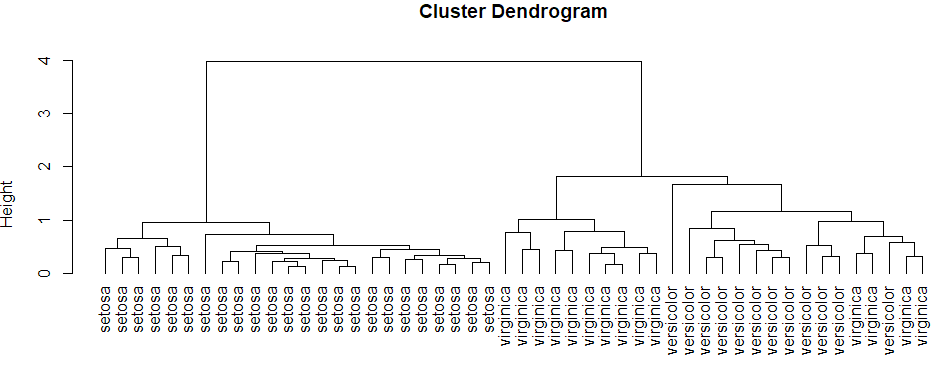
hierarchical clustering
1 | dim(iris)[1] # dim: It retrieve or set the dimension of an object |
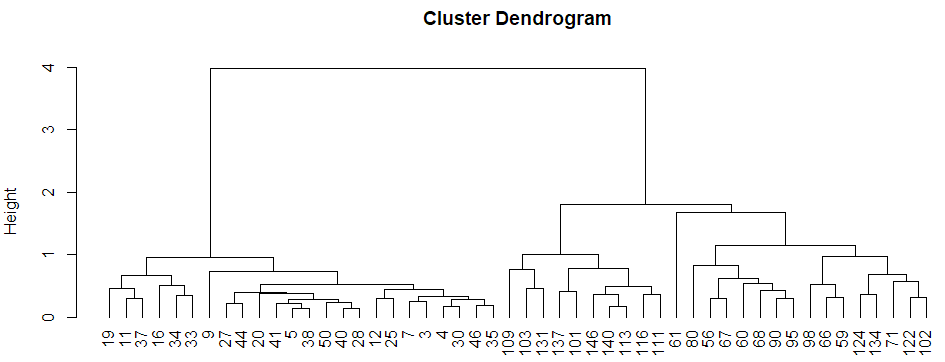
plot hierarchical clustering
1 | hcluster<-hclust(dist(datairis),method="ave") |
1 | iris$Species |