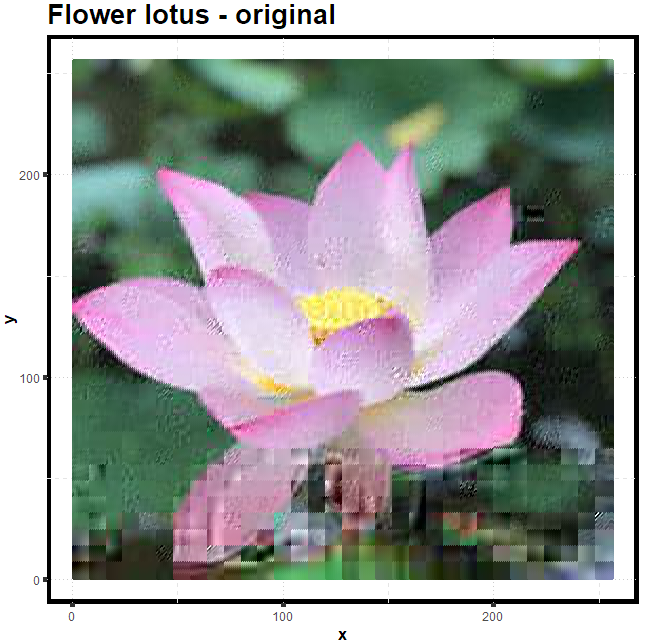
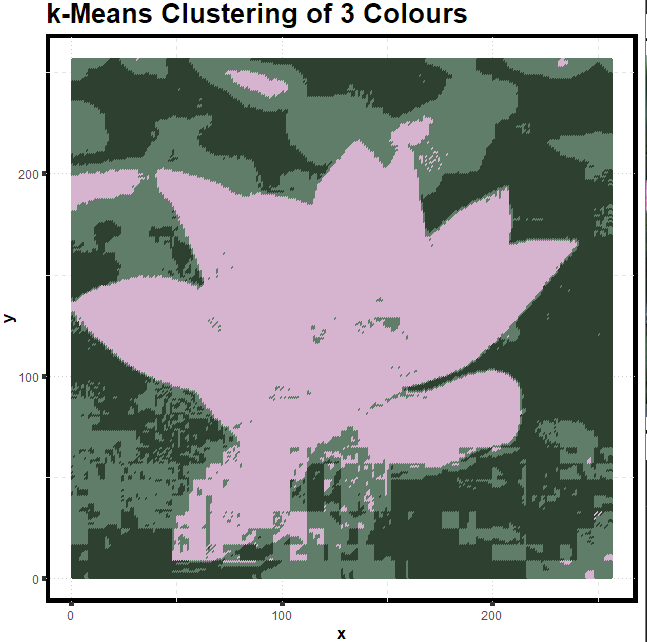
R language to cluster image colors by using k-means clustering

description: cluster colors in a flower image through k-means

downloading and reading image file

1
2
3
4
library("jpeg")
imageurl<-"https://thumbs-prod.si-cdn.com/WRp3AC1A1q3d4_lCe_fzfMmIu0o=/256x256/https://public-media.smithsonianmag.com/accounts/avatars/IMG_E1531.JPG"
dFile <- download.file(imageurl, "lotus.jpg") # download file to workspace
img <- readJPEG("lotus.jpg") # read local image

processing image data

1
2
3
4
5
6
7
8
9
10
imgDm <- dim(img)
imgDm # [1] 879 1200 3
imgRGB <- data.frame(
x = rep(1:imgDm[2], each = imgDm[1]),
y = rep(imgDm[1]:1, imgDm[2]),
R = as.vector(img[,,1]),
G = as.vector(img[,,2]),
B = as.vector(img[,,3])
)
imgRGB # X 1 y 879 R .. G .. B ..

set a theme for drawing the image

1
2
3
4
5
6
7
8
9
10
11
12
13
14
15
16
17
18
19
20
21
22
23
24
25
26
27
28
29
30
31
32
33
34
library(ggplot2)
plotTheme <- function(){
theme(
panel.background = element_rect(
size = 3,
colour = "black",
fill = "white"
),
axis.ticks = element_line(
size = 2
),
panel.grid.major = element_line(
colour = "gray80",
linetype = "dotted"
),
panel.grid.minor = element_line(
colour = "gray90",
linetype = "dashed"
),
axis.title.x = element_text(
size = rel(1.2),
face = "bold"
),
axis.title.y = element_text(
size = rel(1.2),
face = "bold"
),
plot.title = element_text(
size = 20,
face = "bold",
vjust = 1.5
)
)
}

image clustering using K-means clustering

1
2
3
4
5
6
7
8
9
10
kClusters <- 3 
kMeans <- kmeans(imgRGB[,c("R","G","B")], centers = kCluster)
kColours <- rgb(kMeans$centers[kMeans$cluster,])

ggplot(data = imgRGB, aes(x = x, y = y)) +
geom_point(colour = kColours) +
labs(title = paste("k-Means Clustering of", kClusters, "Colours")) +
xlab("x") +
ylab("y") +
plotTheme()

outcome